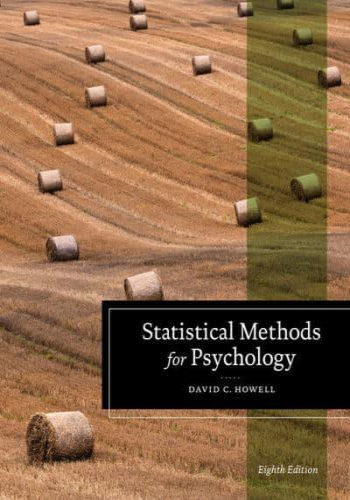
Chapter 1: Introduction to Statistical Methods in Psychology
Summary:
* Defines statistical methods and their role in psychology.
* Discusses types of quantitative and qualitative data.
* Explains basic statistical concepts, including variables, distribution, and probability.
Real Example:
A researcher conducting a study on the effects of sleep deprivation on cognitive performance uses statistical methods to analyze data on reaction times, accuracy, and errors made by participants.
Chapter 2: Descriptive Statistics
Summary:
* Covers measures of central tendency (mean, median, mode) and variability (range, standard deviation, variance).
* Describes methods for visualizing data through histograms, bar charts, and scatterplots.
* Discusses the concept of sampling and sampling error.
Real Example:
A survey of students' preferences for different types of music uses descriptive statistics to summarize the frequency of different music genres selected, the average number of albums owned, and the variability in music spending habits.
Chapter 3: Inferential Statistics
Summary:
* Introduces the concept of hypothesis testing and statistical significance.
* Covers basic inferential tests, including t-tests, chi-square tests, and analysis of variance (ANOVA).
* Explains the importance of effect size and statistical power.
Real Example:
A researcher comparing two groups of participants on a test of spatial reasoning performs a t-test to determine if there is a significant difference between the groups.
Chapter 4: Correlation and Regression
Summary:
* Describes correlation and its measures (Pearson's r, Spearman's rho).
* Introduces simple and multiple regression, which model the relationship between a dependent variable and one or more independent variables.
* Covers the concepts of linearity, slope, and intercept.
Real Example:
A study investigating the relationship between study time and exam scores uses correlation and regression analysis to determine the strength and direction of the association between these variables.
Chapter 5: Non-Parametric Tests
Summary:
* Discusses non-parametric tests that are useful when data do not meet the assumptions of parametric tests (e.g., normality, equal variances).
* Covers tests such as the Mann-Whitney U test, Kruskal-Wallis test, and Friedman test.
* Explains the advantages and disadvantages of non-parametric tests.
Real Example:
A researcher measuring the reaction times of participants in two conditions (a control condition and an experimental condition) uses the Mann-Whitney U test because the reaction time data are not normally distributed.
Chapter 6: Advanced Statistical Methods
Summary:
* Introduces more advanced statistical techniques, such as analysis of covariance (ANCOVA), factor analysis, and path analysis.
* Discusses the use of statistical software packages for data analysis.
* Covers ethical considerations in statistical research.
Real Example:
A study investigating the effects of a training program on cognitive performance uses ANCOVA to control for pre-training differences between participants.


